
11/10/2019 Admin
Adding Charts To Server Side Blazor Using ChartJs.Blazor

You can easily add charts to a Blazor application using ChartJs.Blazor.
To demonstrate this, we will add a chart to the https://github.com/ADefWebserver/FatSecretDataExporter project.
Using ChartJs.Blazor
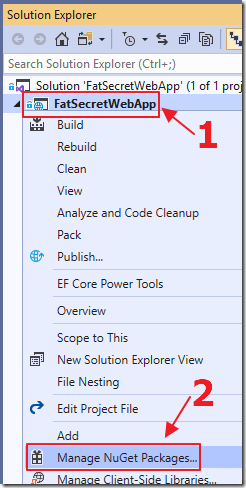
We open the Fat Secret Data Exporter project in Visual Studio and right-click on the project node, and select Manage NuGet Packages…
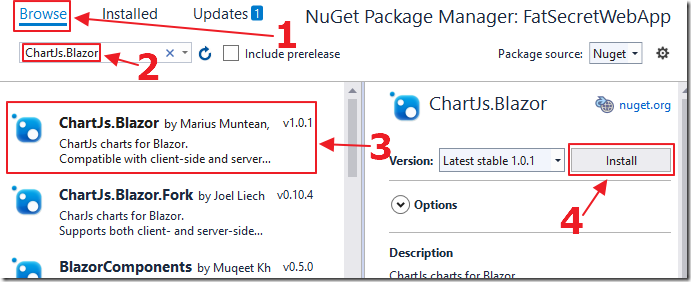
We search for and install the ChartJs.Blazor NuGet package.
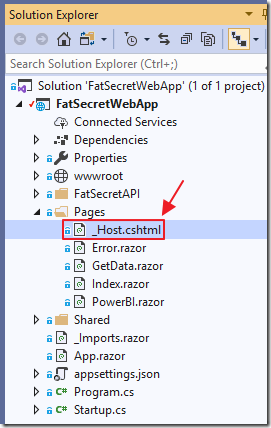
We open the Pages/_Host.cshtml file and add the following code in the HTML body tag:
    <script src="_content/ChartJs.Blazor/moment-with-locales.min.js"
            type="text/javascript" language="javascript"></script>
    <!-- Reference the included ChartJs javascript file. -->
    <script src="_content/ChartJs.Blazor/Chart.min.js"
            type="text/javascript" language="javascript"></script>
    <!-- This is the glue between the C# code and the ChartJs charts -->
    <script src="_content/ChartJs.Blazor/ChartJsInterop.js"
            type="text/javascript" language="javascript"></script>
    <!-- Some styling -->
    <link rel="stylesheet" href="_content/ChartJs.Blazor/ChartJSBlazor.css" />
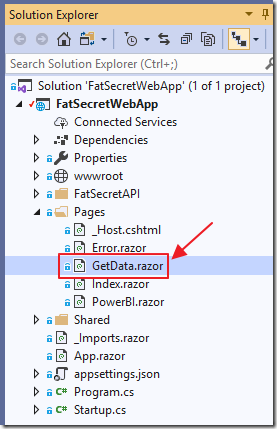
Next, we open the GetData.razor page and add the following using statements:
@using ChartJs.Blazor.Charts
@using ChartJs.Blazor.ChartJS
@using ChartJs.Blazor.ChartJS.Common.Properties
@using ChartJs.Blazor.ChartJS.Common.Enums
@using ChartJs.Blazor.ChartJS.Common.Legends
@using ChartJs.Blazor.ChartJS.Common.Axes
@using ChartJs.Blazor.ChartJS.Common.Axes.Ticks
@using ChartJs.Blazor.ChartJS.Common.Time
@using ChartJs.Blazor.ChartJS.LineChart
@using ChartJs.Blazor.Util
We add the following properties:
    LineConfig _lineConfig;
    ChartJsLineChart _lineChartJs;
    private LineDataset<TimeTuple<int>> _WeightDataSet;
To configure the chart, we add the following to the OnInitializedAsync() method:
        _lineConfig = new LineConfig
        {
            Options = new LineOptions
            {
                Responsive = true,
                Title = new OptionsTitle
                {
                    Display = true,
                    Text = "Weight Chart"
                },
                Legend = new Legend
                {
                    Display = false
                },
                Tooltips = new Tooltips
                {
                    Mode = InteractionMode.Nearest,
                    Intersect = false
                },
                Scales = new Scales
                {
                    yAxes = new List<CartesianAxis>
                    {
                        new LinearCartesianAxis
                        {
                            ScaleLabel = new ScaleLabel
                            {
                                LabelString = "Weight"
                            }
                        }
                    },
                    xAxes = new List<CartesianAxis>
                    {
                        new TimeAxis
                        {
                            Distribution = TimeDistribution.Linear,
                            Ticks = new TimeTicks
                            {
                                Source = TickSource.Data
                            },
                            Time = new TimeOptions
                            {
                                Unit = TimeMeasurement.Day,
                                Round = TimeMeasurement.Day,
                                TooltipFormat = "MM.DD.YYYY",
                                DisplayFormats = TimeDisplayFormats.DE_CH
                            },
                            ScaleLabel = new ScaleLabel
                            {
                                LabelString = "Date"
                            }
                        }
                    }
                },
                Hover = new LineOptionsHover
                {
                    Intersect = true,
                    Mode = InteractionMode.Y
                }
            }
        };
In the same method we define the dataset (_WeightDataSet) that will be used for the chart:
        _WeightDataSet = new LineDataset<TimeTuple<int>>
        {
            BackgroundColor = ColorUtil.FromDrawingColor(System.Drawing.Color.White),
            BorderColor = ColorUtil.FromDrawingColor(System.Drawing.Color.Red),
            Label = "Weight per Day",
            Fill = false,
            BorderWidth = 2,
            PointRadius = 2,
            PointBorderWidth = 2,
            SteppedLine = SteppedLine.False,
            Hidden = false
        };
In the method that retrieves the data (into the colFatSecretWeightOutput collection), we use the following code to populate the _WeightDataSet:
    _WeightDataSet.AddRange(colFatSecretWeightOutput
        .Select(p => new TimeTuple<int>(new Moment(p.Date), Convert.ToInt32(p.Weight))));
    _lineConfig.Data.Datasets.Add(_WeightDataSet);
    _lineChartJs.Update();
Finally, we use the following code, in the page markup, to display the chart:
         <ChartJsLineChart
            @ref="_lineChartJs"
            Config="@_lineConfig"
            Width="100"
            Height="50" />
You can see all the changes required to add the chart to the project in the GitHub changeset at this link.